


Sales dashboard is a simple yet extremely useful tool in sales. At its best, it shows whether the current pipeline is healthy enough to support next month’s target.
It consolidates crucial information in one view, allowing easy access for sales managers to monitor business performance.
This guide covers what a sales dashboard is, the six types used by Indian sales teams, 40+ KPIs worth tracking, and how to connect all the tools your team already uses into a single source of truth.
What is a sales dashboard?
Why does your sales team need a dashboard?
Instant visibility
Managers and reps view pipeline, deals, revenue, and performance health in real time. Eliminates confusion and cuts wasted time from digging through spreadsheets for data.
Early detection & better planning
In case of misaligned goals, let’s say, drop in calls or meetings, pipeline shrinking, or conversion rates dipping, the team can course correct selling methods to fix the issue before it affects revenue.
Accountability without micromanaging (use for celebration & course correction)
Managers can easily monitor rep activities with all updated metrics in one view.
This way, everyone knows:
- Their targets
- Their current numbers
- Where they’re falling behind
Reps who are consistently hitting their quota could be rewarded both monetarily and non-monetarily.
Monetary rewards: Commission, incentive
Non-monetary rewards: Recognition among peers
For reps who fail to do so, their methods could be reviewed and course corrected.
Faster coaching & performance improvement
Using individual numbers, top performers/ managers can identify reps who are new, struggling or stuck and provide coaching to visibly improve performance.
Automated reporting
A CRM-connected sales dashboard eliminates manual data entry: calls are logged automatically, deal stages update in real time, and the dashboard refreshes without anyone touching a formula.
For a team of 5 reps each spending 45 minutes a day on manual reporting, that is 3.75 hours of selling time lost every single day. Over a month, that is roughly 75 hours - the equivalent of a full working week of missed calls and follow-ups that never happened.
Automated reporting also removes selective memory from the equation: reps no longer 'forget' to log calls that went badly, which gives managers cleaner data to coach from."
Forecasting accuracy
With clear pipeline stages and conversion data, forecasts become grounded in reality, not gut feel.
Sales dashboard examples: 6 types
Sales performance dashboard (per rep)
Who’s it for: Sales representative and managers
KPIs to include:
- Closed-won deals
- Conversion rate and customer retention rate
- Revenue generated (filter monthly, quarterly and yearly)
- Opportunities in the pipeline
- Demo scheduled & completed
- Target quota and percentage attained
- Activity (Calls made, emails and follow-up sent)
- Average deal amount
Usage:
Allows individual reps and managers to monitor sales performance while identifying room for improvement.
**Note: You can also view sales team performance for the same KPIs.
Sales leaderboard
Who’s it for: Sales representative and managers
KPIs to include:
- Revenue generated by each rep
- Deals closed (month-to-date and quarter-to-date)
- Average deal size by each rep
- New opportunities in pipeline
- Quota attainment %
Usage: Excellent way of rewarding top performers and motivating other members from the team to push harder with their quota.
In Indian sales teams, this visibility is particularly effective: announcing the top three performers in the Monday morning standup or in the team's WhatsApp group creates genuine peer motivation without requiring additional budget. For reps who are falling behind, the same data lets managers have an evidence-based coaching conversation instead of a vague 'you need to perform better' discussion.
Note: During Q3 (July-September) and the post-Diwali period, pipeline often spikes and then softens sharply. A leaderboard filtered by period helps managers separate genuine high performers from reps who benefited from seasonal demand rather than skill.
Sales pipeline dashboard
Who’s it for: Sales managers, sales analysis team, revenue operations team
KPIs to include:
- Total pipeline value
- Pipeline velocity
- Deals created/lost/won
- Average time in each stage
- Sales cycle length
- Pipeline coverage ratio
Usage: Helps track deals and the speed at which they are moving through the stages in the pipeline. This way, reps and managers can identify early on the deals that are stalling, the ones in perfect momentum and the ones that have high close potential.
Sales activity dashboard
Who’s it for: Sales representatives and sales managers
KPIs to include:
- Calls made
- Emails sent
- Follow-ups completed
- Demo booked and completed
- Average response rate
- Activity-to-meeting ratio
Usage: Top authorities can monitor daily activities of sales reps and whether their efforts are going in the right direction to generate leads/revenue.
Forecasting dashboard
Who’s it for: Sales leaders, revenue operations team, finance team
KPIs to include:
- Forecasted revenue vs actual
- Pipeline coverage ratio
- Win rate
- Average deal amount
- Sales cycle length
- Deal slippage
- Pipeline by stage
Usage: Enables sales leads to predict revenue accurately, helping leadership plan hiring, targets, and cash flow with confidence. It also gives a clear view into AI revenue prediction and rep submitted targets to flag discrepancies early on and motivate the team to achieve maximum potential.
Target account dashboard
Who’s it for: Account executives and ABM teams
KPIs to include:
- Account health score
- Engagement per target account
- Touchpoints per account
- Meetings booked per account
- Opportunities created from target accounts
- Deal stage progression
- Win rate by account
Usage: Helps focus on sales and marketing efforts on high-value, promising clientele.
Sales dashboard metrics
Pipeline metrics
- Total pipeline value → Total potential revenue from all active opportunities in the pipeline.
- Pipeline by stage → Breakdown of pipeline value or deals across different sales stages.
- Pipeline coverage ratio (pipeline ÷ quota) → Ratio of total pipeline value to sales target, indicating if pipeline is sufficient to hit quota.
- Number of deals in pipeline → Total count of active deals currently being worked.
- Average deal size → Average revenue generated per closed-won deal.
- Deal velocity (time to move between stages) → Speed at which deals progress through different stages of the pipeline.
- Stage-wise conversion rates → % of deals that successfully move from one stage to the next.
- Win rate (overall & stage-wise) → % of opportunities converted into closed-won deals.
- Loss rate → % of opportunities that are lost out of total deals pursued.
- Stalled deals / inactive deals → Deals that have shown no activity or progress for a defined period.
- Pipeline growth rate → % increase or decrease in pipeline value over a specific time period.
- New opportunities created → Number of new deals added to the pipeline within a given timeframe.
- Qualified opportunities (SQLs) → Number of leads that meet qualification criteria and are accepted by sales.
- Opportunity aging → Average time deals spend in the pipeline or in a specific stage.
- Pipeline distribution (by rep / region / segment) → Breakdown of pipeline across sales reps, geographic regions, or customer segments.
Activity metrics
- Calls made and emails sent → Total number of outbound calls and emails executed by reps.
- Emails sent → Total number of emails sent to prospects or customers.
- Meetings booked & completed → Number of meetings scheduled and successfully conducted.
- Demos scheduled & completed → Number of product demos planned and actually delivered.
- Follow-ups done → Number of follow-up interactions made with leads or opportunities.
- Tasks completed → Number of assigned sales tasks (calls, emails, reminders) completed.
- Response time (lead response speed) → Average time taken to respond to a new lead.
- Touchpoints per lead → Average number of interactions required to engage a lead.
- Social touches (LinkedIn, etc.) → Number of interactions made via social platforms like LinkedIn.
- Outbound sequences started → Number of automated or manual outreach sequences initiated.
- Inbound leads handled → Number of incoming leads responded to or worked by the team.
- Call duration → Average length of sales calls.
- Activity-to-meeting ratio → Number of activities required to generate one meeting.
Performance metrics
- Lead-to-opportunity conversion rate → % of leads that turn into qualified opportunities.
- Opportunity-to-win conversion rate → % of opportunities that end in closed-won deals.
- Lead-to-win conversion rate → % of total leads that ultimately become customers.
- Sales cycle length → Average time it takes to move a deal from first contact to close.
- Average time to close → Average duration taken to close won deals specifically.
- Quota attainment (%) → % of assigned sales target actually achieved by a rep or team.
- Deals closed per rep → Number of deals successfully closed by each sales rep.
- Average selling price (ASP) → Average revenue generated per closed deal.
- Win rate by rep → % of deals won by each rep out of their total opportunities.
- Win rate by source → % of deals won from each lead source (e.g., inbound, outbound, ads).
- Cost per acquisition (CPA) → Total marketing + sales cost to acquire one customer.
- Customer acquisition cost (CAC) → Total cost of acquiring a customer including salaries, tools, and overhead.
- Revenue per rep → Total revenue generated by each sales rep.
- Activity-to-close ratio → Number of activities (calls, emails, meetings) required to close one deal.
- Demo-to-close ratio → % of demos that convert into closed-won deals.
Revenue metrics
- Total revenue (MRR / ARR / one-time) → Total income generated from all customers, including recurring and one-time payments.
- Bookings → Total value of deals signed within a specific period, regardless of when revenue is realized.
- Closed-won revenue → Revenue from deals that have been successfully closed as won.
- Revenue vs target → Actual revenue generated compared to the set sales target.
- Monthly / quarterly growth rate → % increase (or decrease) in revenue compared to the previous month or quarter.
- Average revenue per customer (ARPU) → Average revenue generated per customer over a specific period.
- Expansion revenue (upsell / cross-sell) → Additional revenue generated from existing customers through upgrades or add-ons.
- Renewal revenue → Revenue generated from customers renewing their contracts or subscriptions.
- Churn rate (revenue churn & logo churn) → % of revenue or customers lost over a given period.
- Net revenue retention (NRR) → % of revenue retained from existing customers including expansions, upsells, and churn.
- Gross revenue retention (GRR) → % of revenue retained from existing customers excluding any expansion revenue.
- Revenue by segment / product / region → Breakdown of revenue based on customer segments, product lines, or geographic regions.
- Forecasted revenue vs actual → Comparison between predicted revenue and the revenue actually achieved.
- Deal slippage (missed revenue) → Value of deals expected to close in a period but pushed to a later timeframe.
You don’t need all the metrics in one view, only 8-12 maximum for a high-performing Sales KPI dashboard.
- Pipeline coverage
- Win rate
- Sales cycle
- Revenue vs target
- Activity (calls/meetings)
- Conversion rates
- Deal velocity
- Forecast accuracy
Note: The above metrics are customizable to suit your needs.
How to extract data for a sales dashboard? 7 sources explained
1. CRM (your primary source)
Example: Superleap
What you get:
- Pipeline data (stages, deal value, deal status)
- Lead & opportunity data
- Deal history (win/loss, timestamps)
- Rep performance
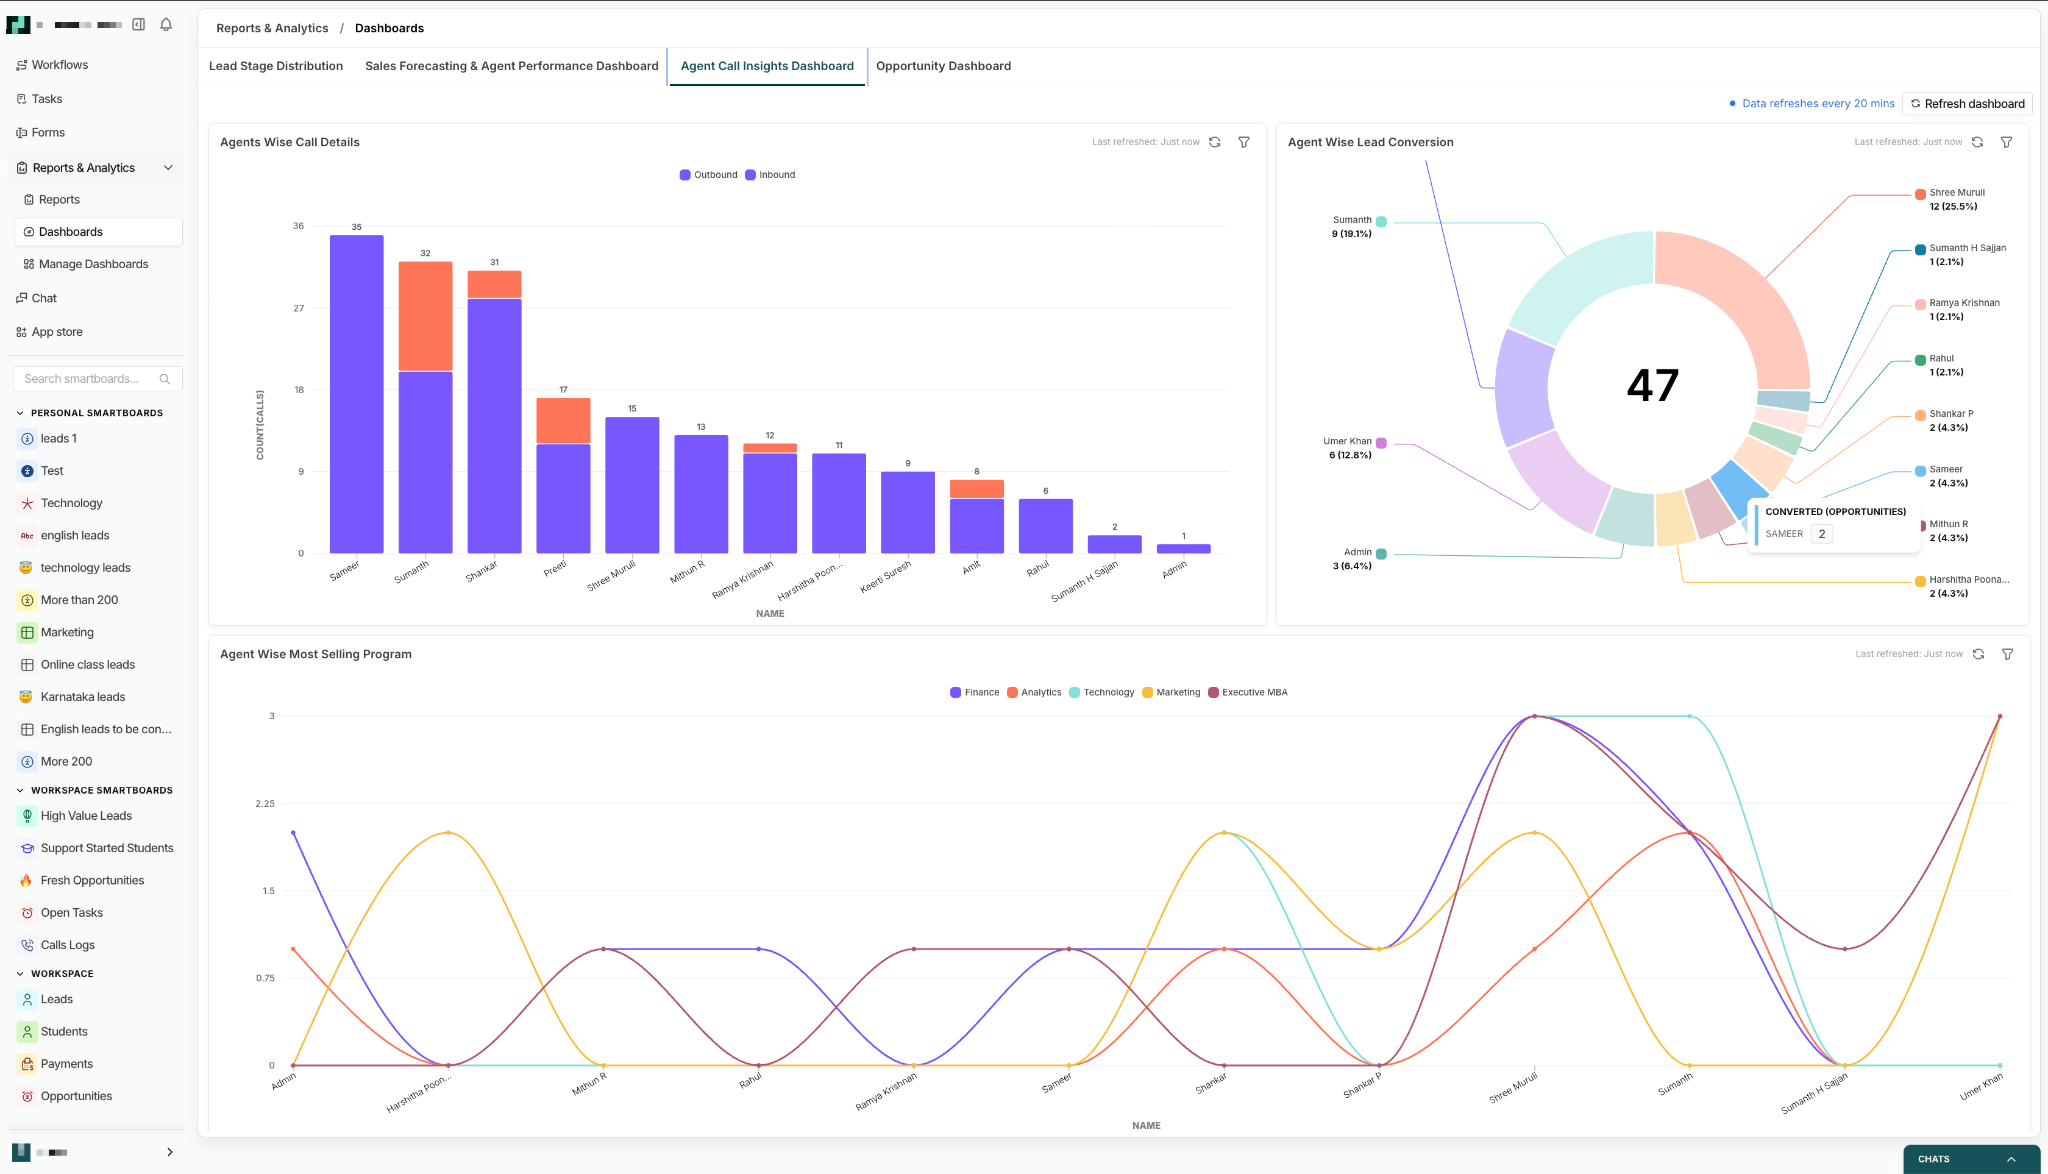
Superleap's CRM dashboard shows pipeline by stage, rep-wise activity (calls made, demos booked, follow-ups completed), deal velocity, and revenue vs target - updated in real time without requiring manual data entry from your reps. Unlike standalone BI tools like Power BI or Tableau, it does not require a data analyst to build or maintain. A sales manager can set up their dashboard view in under 30 minutes.
See how Superleap's sales dashboard works
Why it matters: This is your single source of truth for pipeline, deals, and revenue.
2. Sales engagement tools
Examples: Exotel, Outreach, Apollo
What you get:
- Calls, emails, sequences
- Activity logs (touchpoints, follow-ups)
- Response rates
Why it matters: Feeds your activity metrics (effort → pipeline creation). Most Indian teams use their CRM's built-in sequencing or a connected dialer as mentioned.
3. Marketing automation platforms
Examples: Marketo
What you get:
- Lead source (organic, ads, events)
- Campaign performance
- MQL → SQL movement
Why it matters: Connects marketing to revenue (helps measure source-wise performance).
4. Product analytics / website tracking
Examples: Google Analytics, Mixpanel
What you get:
- Website visits, conversions
- Pricing page hits, demo requests
- User behavior signals
Why it matters: Helps with intent signals + trigger-based outreach.
5. Communication tools
Examples: Gmail, Outlook, call dialers, WhatsApp Business
What you get:
- Email threads
- Call logs & recordings
- Response times
Why it matters: Adds depth to activity tracking + response speed metrics.
6. Finance / billing systems
Examples: Stripe, QuickBooks
What you get:
- Revenue (MRR, ARR, one-time)
- Payments, invoices
- Renewals, churn
Why it matters: This is your actual revenue layer (not just pipeline assumptions).
7. Customer success tools
Examples: Gainsight, Freshsuccess
What you get:
- Renewals
- Expansion (upsell/cross-sell)
- Churn data
Why it matters: Essential for NRR, GRR, and retention metrics.
Sales dashboard for Indian teams: FMCG, Pharma, and B2B
A sales dashboard template built for a US SaaS company looks nothing like what an FMCG area manager in Nashik or a pharma MR in Hyderabad actually needs - here is how to configure your dashboard based on how Indian sales teams actually operate in the field.
Most “standard” sales dashboards assume a digital pipeline - emails, demos, deals. But in India, large parts of sales still happen physically: store visits, doctor meetings, distributor follow-ups. That means your dashboard needs to capture movement in the field, not just movement in a funnel.
FMCG sales dashboard (India)
In FMCG, sales success is driven by consistency, coverage, and execution - not just revenue numbers.
Field rep view (daily execution)
For frontline reps, the dashboard should focus on:
- Outlet visits vs beat plan (planned vs actual coverage)
- Order value vs daily/weekly target (₹)
- Collection efficiency (how much payment was collected vs pending)
This gives a clear picture of whether the rep is doing the basics right - showing up, selling, and collecting.
Area manager view (team performance)
Managers need a slightly different lens:
- Rep-wise outlet coverage (who is underperforming on visits)
- Scheme utilisation (are trade offers actually being pushed?)
- Returns % (a key signal of overstocking or poor demand planning)
This helps identify not just who is performing, but why.
Why mobile-first is non-negotiable
FMCG reps spend 8+ hours in the field. If your dashboard only works well on the desktop, it won’t get used.
Updates need to happen on the go - after each visit, each order, each collection. A mobile-first CRM/dashboard isn’t a feature here - it’s the foundation.
Seasonal adjustment (reading performance correctly)
India’s FMCG cycle spikes before Diwali (Q3: July-September pipeline build-up), followed by softer demand immediately after.
A good dashboard should reflect this seasonality. If a rep’s numbers dip post-festival, it shouldn’t automatically flag underperformance. Context matters - and dashboards should account for it.
Town-class tracking (A/B/C/D markets)
Your dashboard should allow filtering by town class (A/B/C/D) to track rural and semi-urban penetration.
Without this, you miss where the next layer of growth is actually coming from.
Pharma sales dashboard (Medical representative / MR)
Pharma dashboards are less about volume and more about influence.
Primary KPIs:
- Doctor visits per day
- Chemist coverage %
- New prescriptions generated
- Sample accountability (what was distributed vs utilized)
These metrics directly tie to prescription behaviour - the core driver of pharma sales.
Tour programme compliance
Every MR operates on a predefined tour plan. Tracking adherence to this plan is critical.
If visits aren’t happening as scheduled, downstream performance drops - and the dashboard should flag this early.
Cross-referencing with IQVIA data
Monthly performance should be validated against external benchmarks like IQVIA (formerly IMS).
IQVIA is a multinational company that provides data analytics, technology solutions, and research services to the life sciences and healthcare industries.
This helps answer a crucial question: Is the rep’s activity translating into actual market movement?
Why call average is different in pharma
In SaaS or FMCG, more calls can mean more output. In pharma, that’s not always true.
One high-influence doctor can drive more prescriptions than 50 chemists. So dashboards must balance quantity (calls made) with quality (who was visited).
B2B Sales Dashboard for Indian Companies
B2B dashboards in India need to reflect complexity - longer cycles, multiple stakeholders, and informal communication channels.
Buying committee tracking
Unlike simple pipelines, Indian B2B deals often involve:
- Procurement manager
- End user
- CFO or finance head
- Business owner/promoter
Your dashboard should track touchpoints for each stakeholder. Missing one key person can stall the deal completely.
WhatsApp as a deal channel
In India, deals don’t move on email alone.
If your CRM is integrated with WhatsApp, your dashboard should show:
- Number of WhatsApp messages exchanged
- Response time
- Last interaction timestamp
CFO gatekeeper visibility
In many family-run or mid-sized businesses, the CFO (or equivalent) is the final decision-maker.
Add a simple field: “CFO engaged - Yes/No”
This single metric can explain why deals are stuck. If the CFO hasn’t been looped in, the deal isn’t as advanced as it looks.


.svg)
.svg)
.svg)
.svg)