


In sales, what gets measured gets managed - and what gets managed gets improved. But sales performance is not just about the targets you hit at the end of the quarter. It also means asking: How did we achieve those numbers? What are individual reps contributing? Is the process working or does it need to be rebuilt?
This guide covers the 13 key sales performance metrics you need to track, how to measure them, common mistakes to avoid, and how to improve results across your team.
What are sales performance metrics?
These metrics fall into three core categories:
Activity metrics: volume and effort indicators
Conversion and performance metrics: efficiency and deal outcomes
Customer value and retention metrics: long-term revenue health
Why sales performance metrics matter
Tracking the right metrics drives better outcomes across the entire revenue engine. Here is why it matters:
- Enables data-backed decision-making instead of gut-feel calls
- Supports accurate revenue forecasting
- Highlights pipeline bottlenecks before they cost you deals
- Gives visibility into individual rep productivity
- Supports performance-based coaching and training
- Reveals trends that drive long-term growth
The 13 sales performance metrics
Activity metrics
1. Number of calls made
This tracks the volume of outbound calls a rep makes and how frequently. It is a leading indicator of pipeline creation - more quality outreach generally leads to more opportunities. Use it alongside conversion metrics to ensure volume is translating into results, not just activity.
2. Sales revenue
Sales revenue is the total money generated from closed deals. It can come from one-time purchases, subscriptions, or recurring payments. Track this by rep, territory, and product line to identify where your strongest performance lives and where resources need to be reallocated.
For underperforming reps, dive into what is breaking down - whether it is prospecting, qualification, or closing - then use role-plays and recorded call reviews to target the specific gap.

3. Monthly recurring revenue (MRR)
MRR measures the revenue your business generates each month from subscriptions. It is the most critical metric for SaaS and subscription businesses. Track MRR across four dimensions:
- New MRR from new customer wins
- Expansion MRR from upsells and cross-sells
- Churned MRR from cancellations
- Net MRR growth month over month
Higher MRR growth with low churned MRR signals a healthy and efficient sales motion.
Conversion and performance metrics
4. Number of qualified leads
A qualified lead has demonstrated genuine interest, has a real need for your solution, and holds purchasing authority. Tracking this metric tells you whether your lead generation and qualification processes are working.
Leads typically fall into two categories:
Marketing Qualified Leads (MQLs): Have shown interest - downloaded content, signed up for a webinar, or requested a demo - but may not yet be ready to buy.
Sales Qualified Leads (SQLs): Have been vetted against criteria like the BANT framework (Budget, Authority, Need, Timeline) and show strong purchasing intent.
Monitoring the ratio of MQLs to SQLs helps identify where leads are dropping off and whether sales and marketing are aligned on what a quality lead looks like.
5. Average deal size
Average deal size is the average revenue earned from each closed deal. It tells you whether your team is focusing on high-value opportunities or spending time on deals that underperform against target.
Formula: Total Revenue Generated ÷ Total Number of Closed-Won Deals
Example:
Total revenue: $200,000
Closed-won deals: 30
Average deal size: $200,000 ÷ 30 = $6,667
A declining average deal size may indicate reps are discounting too aggressively or targeting smaller accounts. A growing number suggests your team is moving upmarket or packaging more effectively.
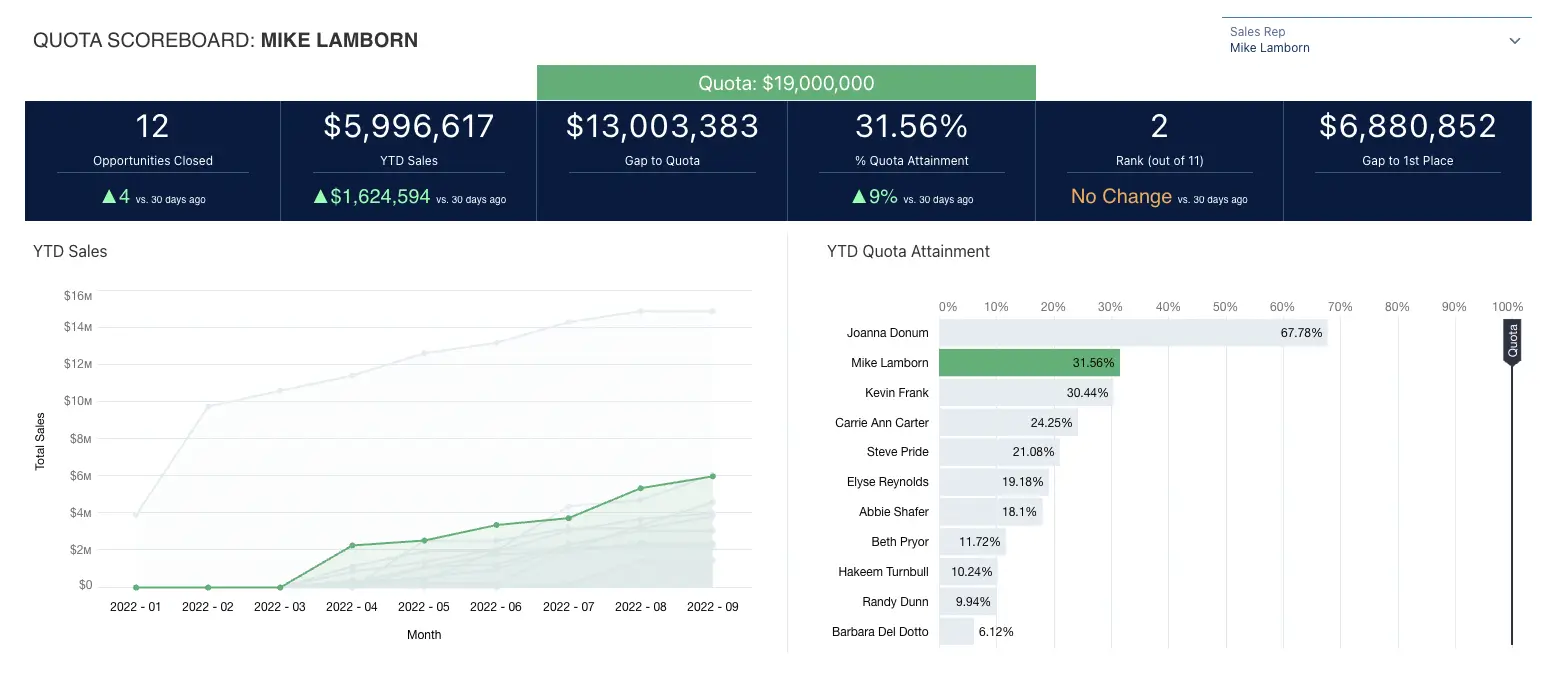
6. Quota attainment
Quota attainment measures whether reps are hitting their assigned targets - typically tracked monthly, quarterly, and annually. It is a direct indicator of individual performance and team health. Use it to identify top performers, flag reps who need coaching, and inform forecasting for the next period.
Watch for consistently unattained quotas across the team - this may signal unrealistic targets, poor territory allocation, or a broken sales process rather than individual rep failure.
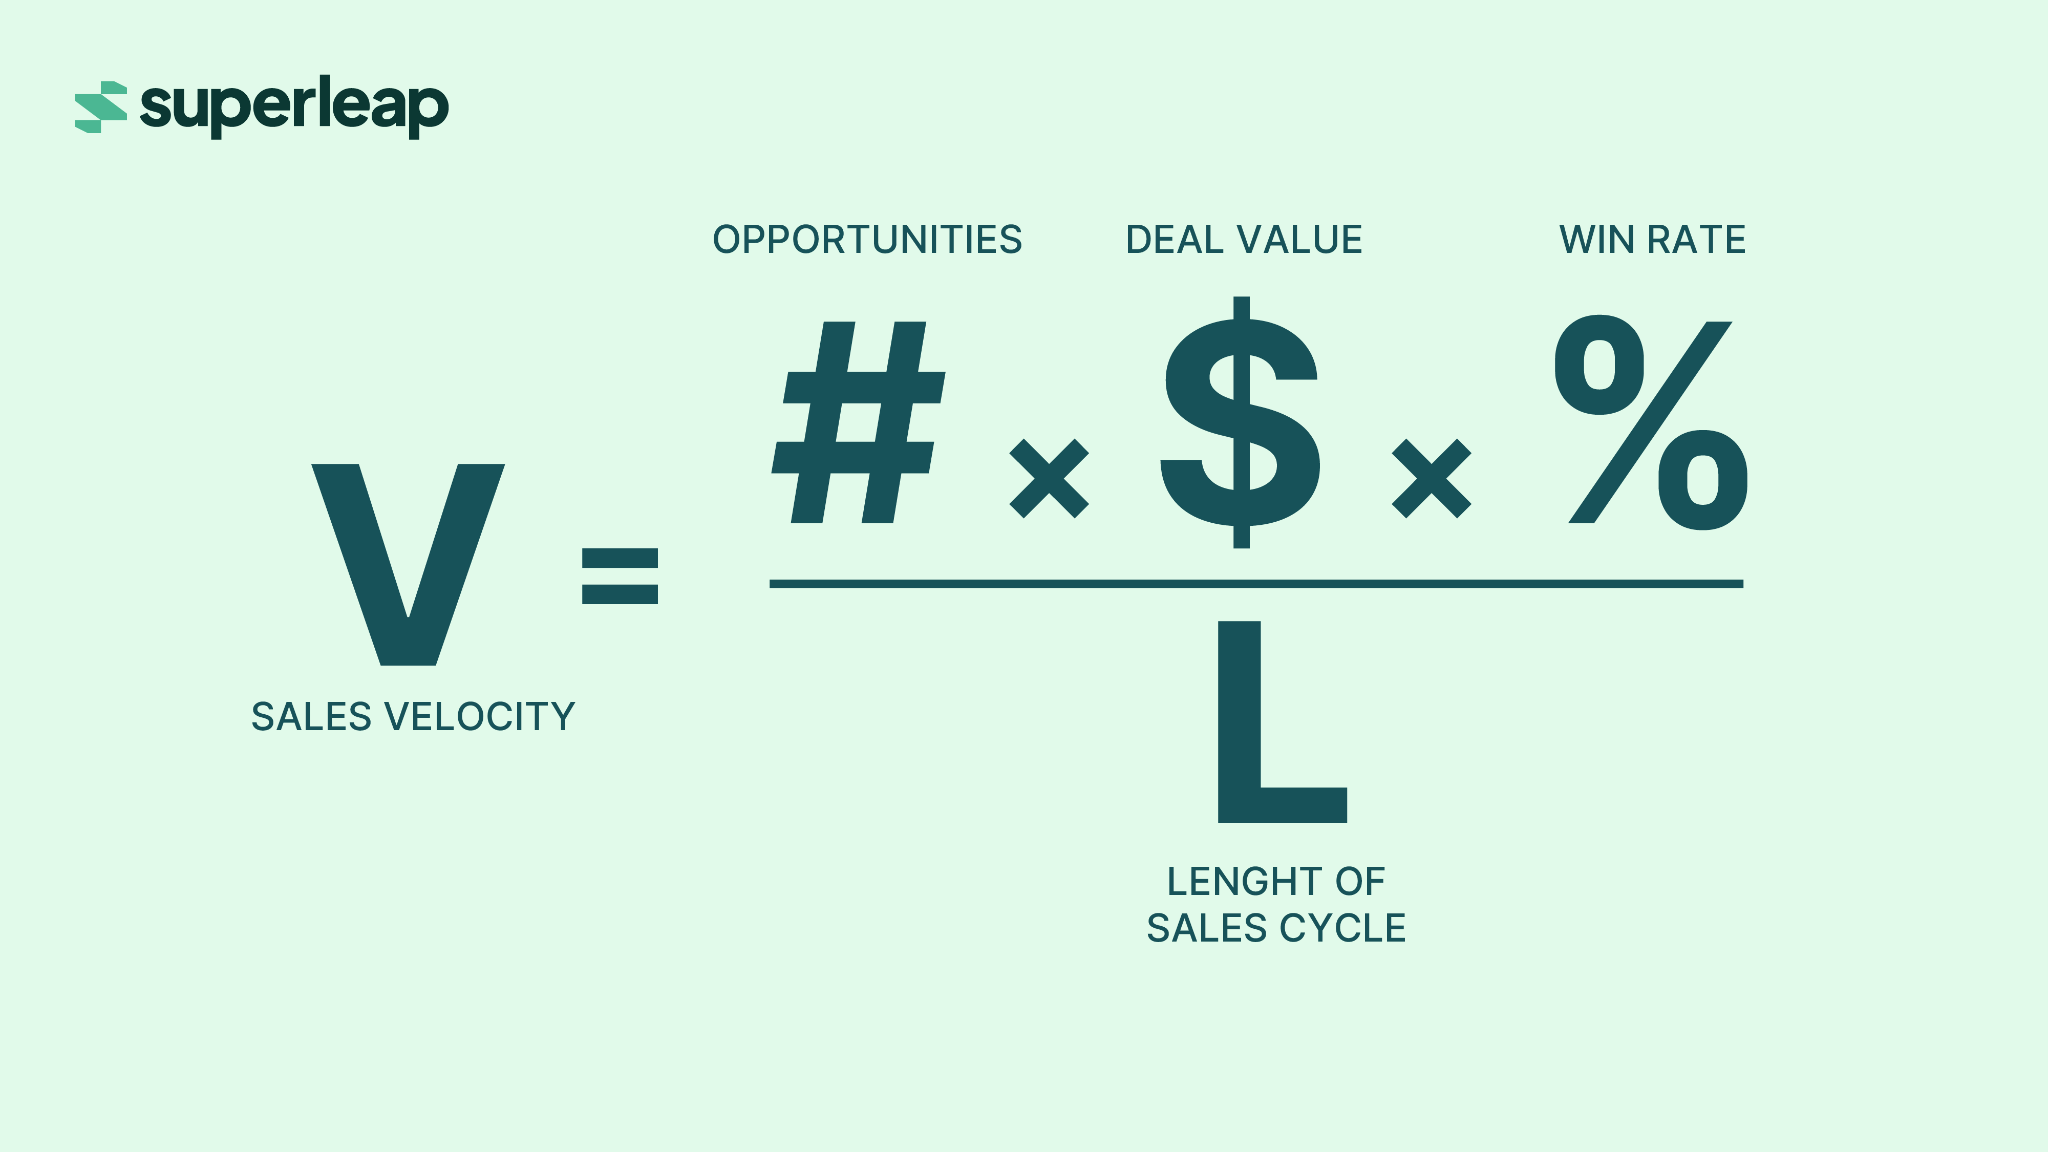
7. Sales cycle length
Sales cycle length is the average time from first meaningful touch to a closed-won deal. B2B cycles typically range from a few weeks to several months depending on deal size and industry. B2C cycles can close in minutes.
A shortening cycle suggests reps are improving at qualifying buyers and reducing friction. A lengthening cycle points to bottlenecks - commonly in procurement, legal review, or multi-stakeholder alignment. Tracking this alongside the win rate gives you a fuller picture of pipeline efficiency.
See our guide on sales velocity to understand how cycle length directly affects revenue speed.
8. Conversion rate
Conversion rate measures the proportion of opportunities that become closed-won deals. A high conversion rate signals strong qualification and consistent execution. A low rate suggests a competency gap in discovery, demos, or objection handling - or that the wrong leads are entering the pipeline.
Formula: Closed-Won Deals ÷ Total Opportunities × 100
9. Revenue growth
Revenue growth tracks the increase in total revenue over a defined period. It is the outcome of consistent new customer acquisition, effective retention, and successful upsell and cross-sell execution. Use it to evaluate whether your current strategy is compounding or plateauing.
10. Win rate
Win rate is the percentage of deals in your pipeline that close as won. It differs from conversion rate in that it is typically measured at the opportunity stage rather than across all leads.
Formula: Closed-Won Deals ÷ Total Deals Entered Pipeline × 100
Benchmark your win rate by rep, segment, and deal size to find where your team performs strongest and where coaching is needed.
Customer value and retention metrics
11. Customer lifetime value (CLV)
CLV measures the total revenue a customer generates across the entire relationship with your business. A high CLV signals that customers are getting sustained value from your product - and that your team sold to the right people with the right expectations.
A declining CLV often points to misaligned sales conversations at the top of the funnel: reps over-promising, mis-qualifying, or selling to customers who are not a good fit.
12. Customer retention rate
Retention rate tracks the proportion of customers who continue doing business with you over a given period. Beyond the revenue implications, it is a signal of the long-term relationships your sales team is building.
A rep who consistently closes clients who churn within 90 days is performing differently from one whose clients renew and expand - even if their initial sales numbers look the same.
13. Churn rate
Churn rate measures the percentage of customers who stop doing business with you over a set time period.
Formula: (Customers Lost ÷ Customers at Start of Period) × 100
Early churn is a leading indicator that reps are bringing in the wrong customers. A low churn rate reflects honest selling: reps set accurate expectations, communicated real value, and qualified carefully. Use churn data to refine your ICP and improve the lead qualification process.
How to measure sales performance
Use a CRM as your single source of truth
A CRM like Superleap centralises deal progress, call logs, meeting history, and rep activity in one place. Use it to track which deals are accelerating, which are stalling, and where pipeline is concentrated.
Set the right measurement cadence
Daily: Activity metrics - calls made, emails sent, meetings booked
Weekly: Pipeline reviews, deal stage progression, forecast updates
Monthly and quarterly: Quota attainment, win rates, average deal size, rep evaluations
Set SMART goals for each metric
Vague targets produce vague results. Use the SMART framework to define goals that are Specific, Measurable, Achievable, Relevant, and Time-bound.
For example, instead of "generate more leads," set a target of 25 qualified SQLs per rep per month, tracked in the CRM against a 30-day window.
Compare individual vs team performance
If total revenue is growing but only two or three reps are driving the number, the team has a concentration risk. When a top performer leaves, results collapse. Track metrics at both the rep and team level to ensure performance is distributed and skill gaps are caught early.
Automate reporting
Manual reporting introduces delays and errors. Automate dashboards that pull directly from your CRM and update in real time. Key reports to build: pipeline health, forecast accuracy vs actuals, and a rep leaderboard with full metric visibility.
How to improve sales performance
At the rep level
- Run short, focused training sessions (5 to 10 minutes) on specific skills: objection handling, BANT qualification, or demo structure
- Review recorded sales calls regularly to identify missed opportunities
- Conduct 1:1 coaching sessions tied to each rep's specific metric gaps
- Align incentives and compensation to the metrics that matter most
💡 Expert tip: Here’s a take on coaching sales managers to be better coaches by Elay Cohen, CEO of SalesHood, an AI-driven revenue enablement platform.
At the process level
- Tighten lead qualification criteria to reduce time spent on poor-fit opportunities
- Use data to identify where deals stall most frequently in the funnel
- Invest in sales enablement tools that reduce administrative work
- Automate proposals and contracts to cut lag between verbal agreement and close
- Leverage AI tools for lead scoring, email optimisation, and forecasting accuracy
Sales performance tools
CRM (Superleap): Pipeline management, deal tracking, activity logging, and forecasting.
Sales analytics platforms (Gong): Conversation intelligence to identify winning behaviours and coach reps.
LinkedIn Sales Navigator: Prospecting, account research, and outreach performance tracking.
Sales engagement tools: Sequence automation and follow-up cadences to reduce manual outreach effort.
Improving sales performance requires consistent measurement, coaching, and process optimization rather than one-time interventions.
💡 Expert tip: Here’s a take on coaching sales managers to be better coaches by Elay Cohen, CEO of SalesHood, an AI-driven revenue enablement platform.


.svg)
.svg)
.svg)
.svg)