
.jpg)


CRM analytics and performance tracking help businesses measure sales results, understand customer behavior, and make better data-driven decisions.
But there is an important distinction between CRM metrics and CRM dashboards. Metrics are the measurements themselves; a dashboard is the visual layer that brings the most useful measurements together for a specific person, team, or business goal.
This blog explains what CRM metrics are, how to track them, and how CRM dashboards simplify performance tracking for sales and marketing teams.
What is a CRM dashboard?
A CRM dashboard is a visual interface that organizes important CRM data into charts, graphs, tables, KPI cards, and other components so teams can monitor performance without digging through individual records or running multiple reports.
Think of it as the operational view of your CRM data. Instead of asking someone to pull together numbers from different reports every time a question comes up, a dashboard puts the most relevant information in front of the person who needs it.
For example, a sales manager opening their dashboard on Monday morning might immediately see total pipeline, opportunities by stage, deals without recent activity, sales won this month, and progress against target. The dashboard does not replace the underlying CRM records. It makes the important signals from those records easier to see.
A sales representative might have an even narrower dashboard showing open opportunities, upcoming activities, follow-ups, and progress toward their individual target. The same CRM can therefore support several dashboards without requiring every user to look at the same information.
What is a CRM metric?
A CRM metric is a measurable value derived from CRM data that helps a business evaluate a specific part of its sales, marketing, customer, or relationship-management performance.
These metrics can include win rate, average deal size, lead response time, churn rate, pipeline coverage, customer satisfaction, or data completeness. Not every CRM metric needs to appear on a dashboard; the useful ones are the metrics that help someone monitor a goal or make a decision.
Why CRM metrics matter (and a couple of numbers to prove it)
There are three broad advantages to tracking your CRM metrics: faster decisions, fewer dropped leads, and repeatable growth.
For context: Nucleus Research’s well-cited analysis found historically high ROI from CRM implementations (the famous “$8.71 returned per $1 spent” analysis), showing CRM can be a very high-leverage investment when implemented well.
Core CRM metrics: what to track + formulas
What are some CRM dashboard examples?
A CRM dashboard should look different depending on who is using it. Here are a few common examples.
1. Sales manager dashboard
A sales manager needs a view of team performance and pipeline movement. Their dashboard could include:
- Pipeline value
- Pipeline by stage
- Win rate
- Sales cycle length
- Forecast vs target
- Deals with no recent activity
- Rep performance
For example, a manager may see that overall pipeline is sufficient but a large portion of it is concentrated in early stages. That is a different situation from having too little pipeline altogether.
2. Sales representative dashboard
A sales rep generally needs a more focused view of their own work and opportunities. Relevant metrics may include:
- Open opportunities
- Upcoming activities
- Overdue follow-ups
- Meetings booked
- Deals won
- Individual quota attainment
- Opportunities by stage
The goal is not to give the rep access to every sales metric. It is to surface the information they can act on during their day.
3. Marketing CRM dashboard
A marketing team may focus on what happens to leads after they enter the CRM. Relevant metrics can include:
- Leads created
- MQL volume
- MQL-to-SQL conversion
- Lead-to-customer conversion
- Cost per lead
- Lead source performance
4. Customer success dashboard
A customer success dashboard may focus more heavily on retention and service performance, such as:
- Churn rate
- Renewal rate
- CSAT
- NPS
- First contact resolution
- Time to resolution
- Customers requiring attention
5. Executive CRM dashboard
An executive dashboard generally needs a high-level view rather than an activity-level view. It could include:
- Revenue
- Pipeline
- Growth
- Win rate
- Customer retention
- Forecast vs target
The underlying CRM data can remain the same while the dashboard changes according to the questions each role needs to answer.
How to choose the right CRM dashboard metrics
Ask these four questions:
1. What decision does this dashboard support?
A dashboard built for forecasting will need different information from one built for managing daily sales activity.
2. Who is going to use it?
The same dashboard should not automatically be given to sales reps, managers, executives, and customer success teams. Each audience has different responsibilities.
3. What is the primary outcome?
Choose the metric that tells you whether the main objective is being achieved. For a sales team, that could be revenue or quota attainment. For customer success, it might be retention or churn.
4. Which supporting metrics explain the movement?
Once the main outcome is selected, add the smaller set of metrics that help explain why the number is changing.
For example, if the objective is hitting a monthly revenue target, revenue vs target is the outcome. Pipeline coverage, win rate, sales cycle, and pipeline by stage can provide the supporting context needed to understand whether the team is positioned to reach it.
What are the benefits of a CRM dashboard?
Centralized data access: All the data from multiple sources is aggregated and accessible in one single dashboard. This immediate visibility saves your time from juggling spreadsheets and reports.
Alignment & accountability: When every team member views the same data, they stay aligned. Sales knows what leads marketing brings in, marketing sees if leads are converting, and the customer success teams monitor churn rates - all enforcing transparency. This shared view promotes accountability and collaboration.
Real-time monitoring: CRM dashboards update on a daily basis, so, if yesterday your sales were higher or lower than expected, you can see it immediately, and make quick decisions.
Superleap dashboard
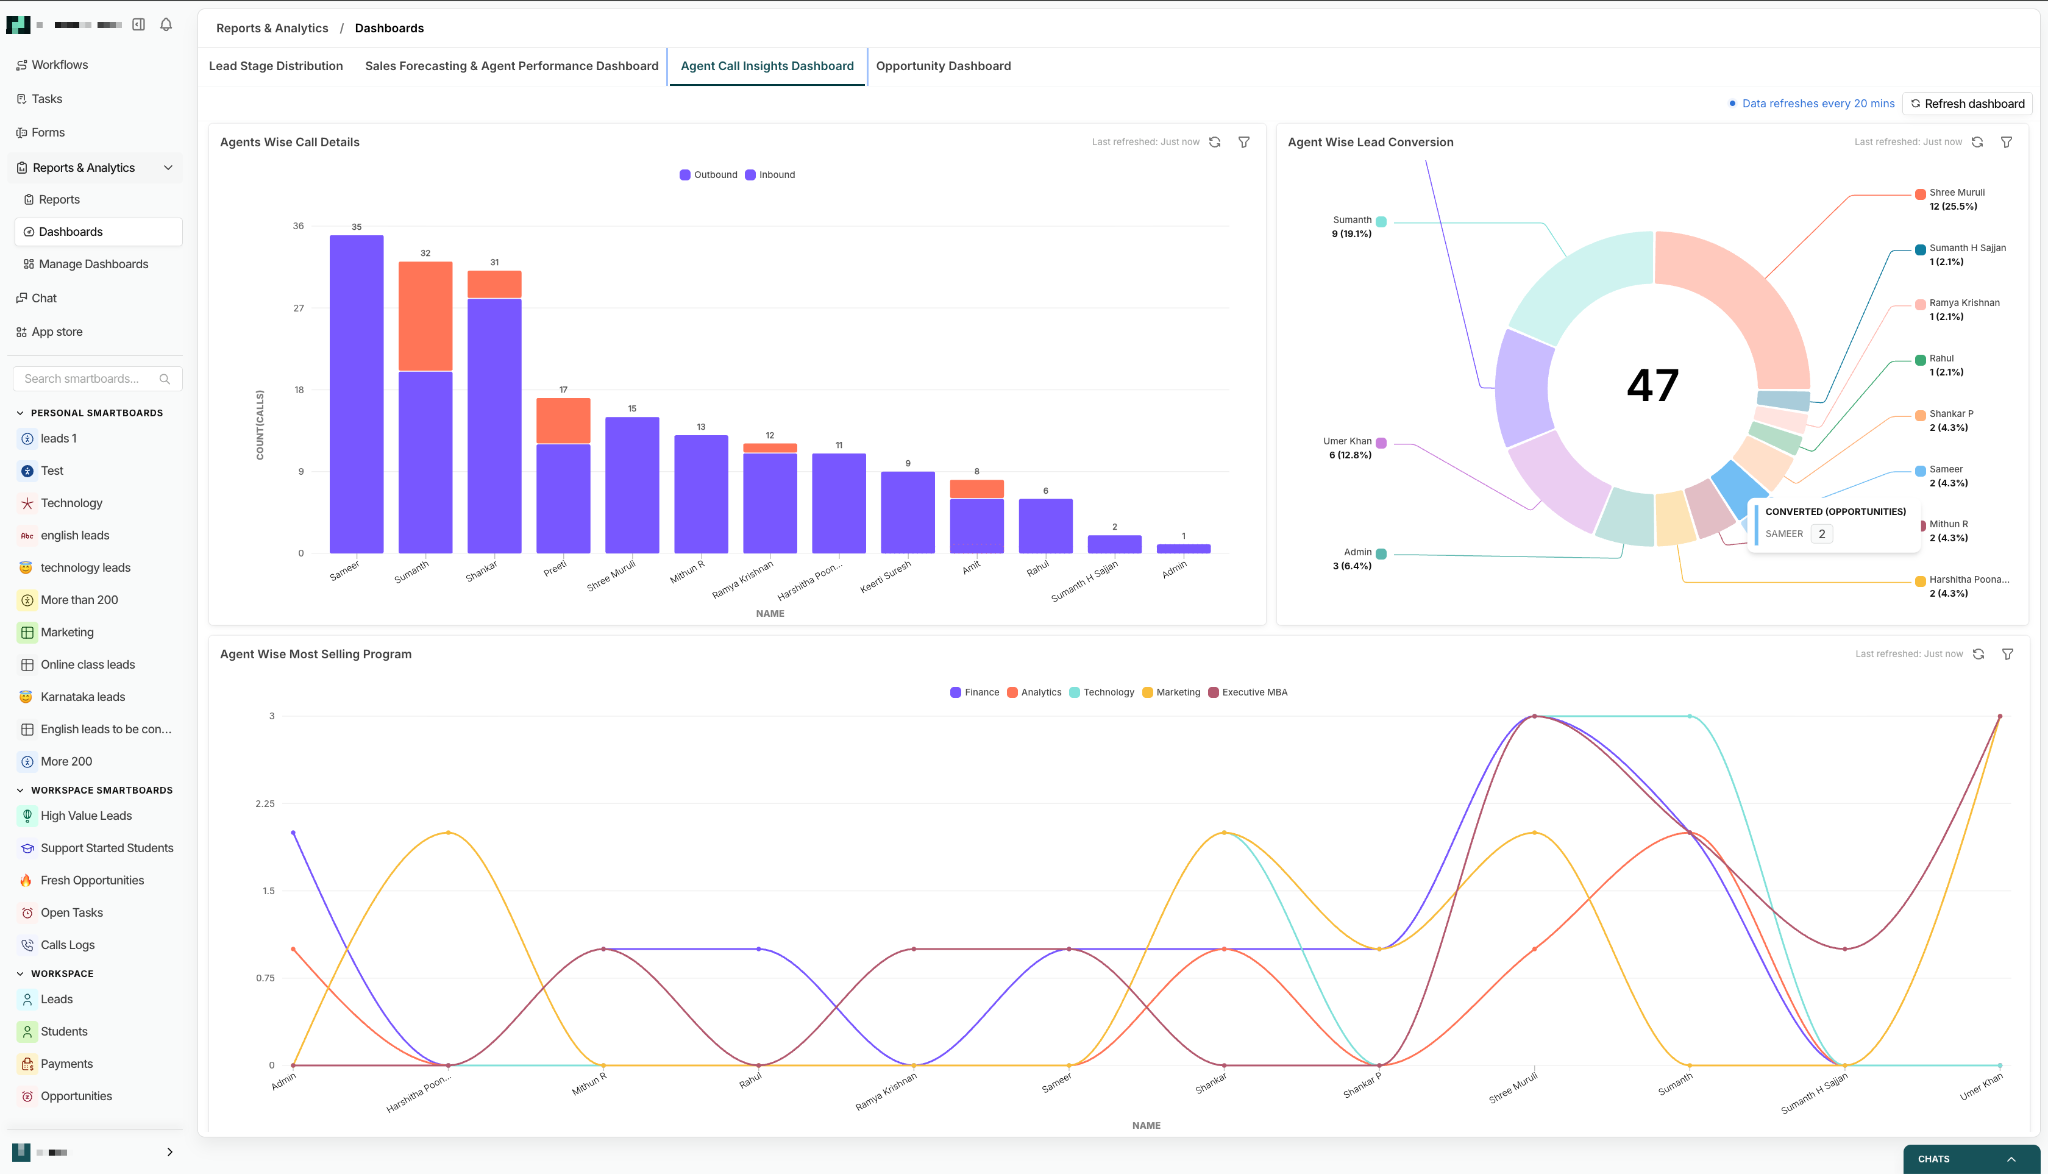
CRM dashboard vs CRM reports
For example, a sales manager may notice on their dashboard that win rate has declined. They can then open a detailed report to examine opportunities by stage, salesperson, industry, source, or time period.
Tools & tech stack
Use the CRM’s native dashboards for operational, real-time needs (activity, pipeline, rep leaderboards). Native dashboards are easiest to update and typically integrate with your workflows. Examples: Superleap.
Use BI tools (Tableau, Power BI, Looker, Mode, Databox) for complex cross-system reports, advanced attribution, or finance-grade forecasting. BI tools are great when you need to blend CRM data with billing, product, and ad platforms.
The key distinction is the scope of the question you are trying to answer. If the team needs to monitor pipeline and sales activity inside the CRM, a native CRM dashboard may be sufficient. If leadership needs to combine CRM data with finance, product, advertising, or other business systems, a BI layer may make more sense.
Conclusion
Picking the right CRM metrics to measure is crucial to the success of a business. When chosen correctly, a dashboard view facilitates quick and smart decision making.



.avif)
%201%20(1).svg)
.svg)
.svg)
.svg)
.svg)