


Sales analysis is the process of examining sales data to understand performance, spot trends and improve decisions.
Geoffrey Moore, a well-known business advisor and author, rightly said, “Without data analytics, companies are blind and deaf, wandering out onto the web like deer on a freeway,” back in 2012 and his words stand true even today.
Let’s understand sales data analysis in detail.
What is sales analysis?
Why is sales analysis important?
- To make informed decisions
- To address risks in your pipeline and resolve them quickly
- To understand customer behaviour
- To identify profitable products and services
- To keep track of progress
- To generate accurate sales forecasts
- To prioritise and keep track of high-value prospects
- To stay one step ahead of the competition

Sales analysis metrics
Conversion Rate
It refers to the percentage of leads or opportunities that turn into actual sales. The conversion rate is a great starting point to get an overview of the effectiveness of the sales process. It also gives businesses an idea about their sales team's performance.
Win Rate
It is the percentage of sales opportunities or deals that a business successfully closes compared to the total number of opportunities pursued.It is calculated by dividing the number of closed deals by the total number of opportunities and then multiplying the result by 100. A higher win rate indicates better sales effectiveness and stronger conversion strategies.
Average Deal Size
This refers to the average value of closed deals or sales transactions that helps in assessing the profitability of individual sales.
Average Order Value
It is the average amount of money spent by customers per order during a specific period of time. It is calculated by dividing total revenue by the number of orders. AOV helps businesses gain insights into how much customers are willing to spend per transaction, which can inform pricing strategies, promotional offers, and product bundling.
Customer Acquisition Cost
This is the total cost of acquiring a new customer, including marketing and sales expenses. Knowing this helps businesses assess the efficiency of their sales and marketing efforts.
Customer Lifetime Value
It is the total amount of revenue a business can expect to generate from a customer throughout their relationship with the company. It helps businesses prioritize long-term customer relationships.
Sales Cycle Length
This refers to the average time it takes to close a deal from initial contact to final sale. By understanding this, businesses can identify areas for improvement in the sales process.
Sales Revenue
This refers to the total income generated from sales over a specific period of time. It represents the top line or gross income figure from which profit is calculated and is a key indicator of business performance.
Lead Response Time
It refers to the average amount of time it takes for a business to respond to a new lead or inquiry after it has been generated. A shorter lead response time is crucial for improving conversion rates because quick follow-up demonstrates responsiveness and helps capitalize on customer interest before it fades.
Sales per Rep
This is the average sales revenue generated by each sales representative, which helps gauge individual performance.

Sales analysis tools
CRM Software
Purpose: Centralize and manage customer and sales information, including leads, interactions, and deal tracking.
Examples: Salesforce, Superleap, Zoho CRM, Hubspot, Pipedrive
Marketing and Sales Automation Tools
Purpose: Combine sales and marketing data to improve lead management and campaign performance.
Examples: HubSpot, MailChimp, Marketo
Sales Analytics and Reporting Tools
Purpose: Analyze sales performance data to uncover trends, insights, and areas for improvement.
Examples: Google Analytics, Mixpanel, Insightsquared
Contract Management Tools
Purpose: Streamline and automate the lifecycle of contracts, from creation to execution, ensuring compliance and improving efficiency.
Examples: IronClad, ContractWorks
Data Visualization Tools
Purpose: Create visual representations of sales data to simplify decision-making.
Examples: Tableau, Power BI, Zoho Analytics
CPQ Software
Purpose: Simplifies and accelerates the sales process by automating product configuration, pricing, and quoting, allowing sales teams to quickly generate accurate quotes for customers.
Examples: Salesforce CPQ, Oracle CPQ
Subscription Management Software
Purpose: Simplify and automate the management of subscription-based services, including billing, renewals, customer lifecycle, and revenue tracking.
Examples: Chargebee, Zuora, Recurly
Sales Forecasting Tools
Purpose: Predict future sales trends based on historical data and market patterns.
Examples: Clari, Anaplan
What factors need to be considered while selecting tools to manage sales data?
- Size of your business: Large enterprises may require advanced tools like Salesforce or Tableau, while small businesses can benefit from Zoho or HubSpot.
- Sales process complexity: Choose tools that match your operational needs, such as forecasting for enterprises or POS systems for retailers.
- Budget: Free or low-cost tools like Google Data Studio or HubSpot CRM are great for smaller teams.
- Integration needs: Ensure compatibility with existing systems like your CRM, ERP, or marketing platforms.
What are the different types of sales data?
Demographic Data
Demographic data includes basic details about your customer, such as their name, age, gender, role, location, and also their contact information. This data acts as the basis for deciding whether the customer fits the Ideal Customer Profile (ICP) or not.
Firmographic Data
Firmographic data refers to a company’s name, location, size, industry, and revenue. While demographic data focuses on the customer, firmographic data focuses on businesses.
Technographic Data
This refers to technologies and tools that target buyers use in their operations, daily work, or personal lives. By identifying gaps or challenges in these tools, you can offer solutions to customers.
Chronographic Data
This data emphasizes operational and financial changes/challenges within businesses. This generally includes the number of new hires in a given period, funding rounds, and acquisitions. By actively tracking these changes, you’ll notice any prospecting opportunities sooner and can capitalize on new needs/pain points.
Intent and Behaviour Data
This data highlights the kinds of content your target buyers consume, how/where they consume it, and what products or services they’ve shown interest in. Using this data, you can create a clear picture of potential customer needs. This, in turn, will help you make informed decisions about what and how to sell and to whom.
Deal Data
Deal data refers to all the information and metrics related to individual sales opportunities or transactions within the sales process. It tracks the journey of a potential sale from initial contact to closure, providing insights into deal characteristics, progress, and outcomes.
Internal Sales Performance Data
Internal sales performance data refers to metrics and insights that measure the effectiveness of a company's sales team and individual sales representatives. This data helps assess how well salespeople are achieving their targets and contributing to overall business goals.
Organisational Identifiers
Organizational identifiers refer to unique attributes or codes used to track and identify specific organizations or entities within a business system. These identifiers help differentiate between various customers, prospects, or partners, enabling easier management of relationships, transactions, and data. They are essential for maintaining accurate records and improving operational efficiency across business functions.
Sales analysis techniques
Once you’ve collected sales data, it’s useful to analyse it to identify trends, patterns, and correlations that can help drive business success. There are various techniques of analysis, such as:
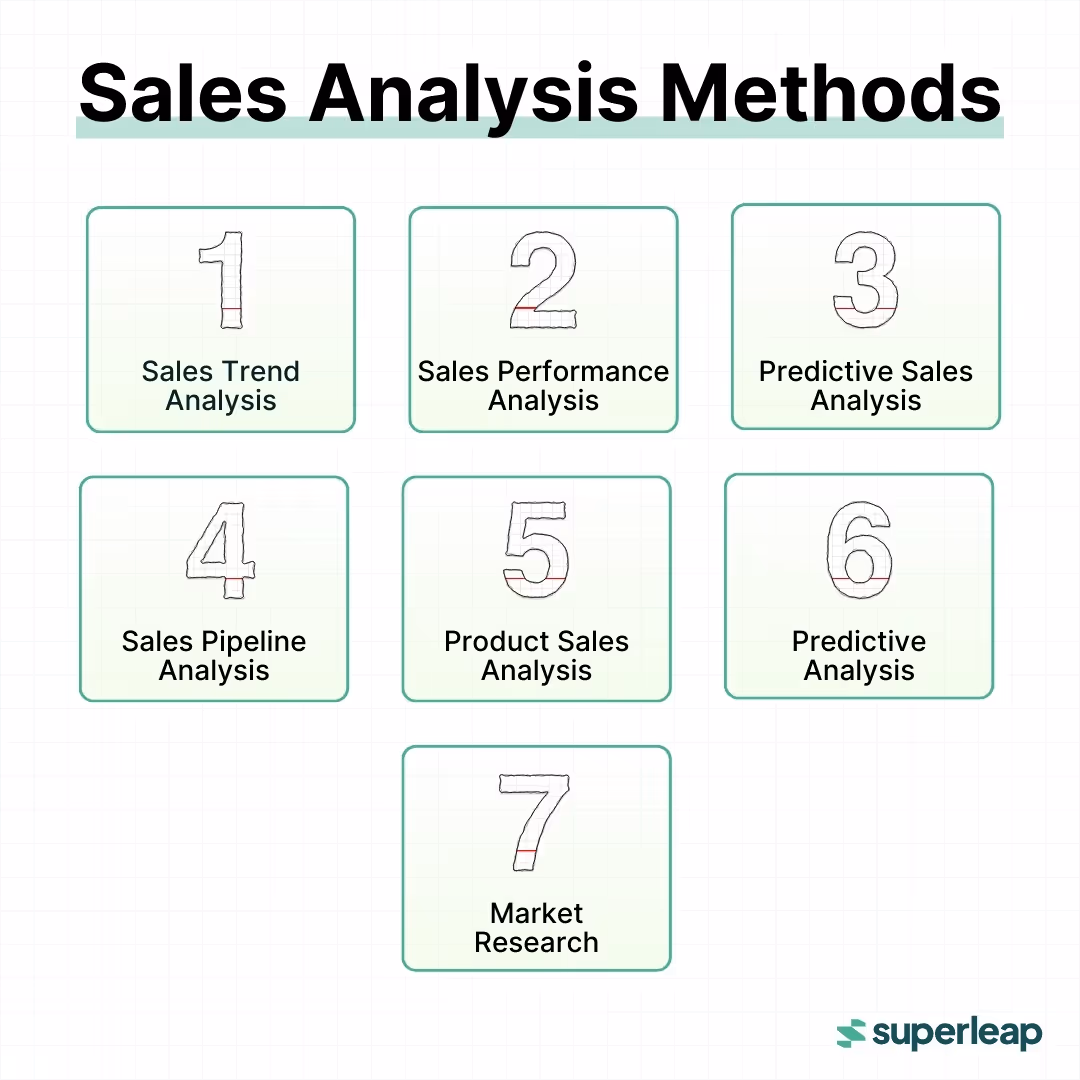
Sales Trend Analysis
This kind of analysis helps you track sales information over a period of time, whether it’s from the previous day, week, month, or year. It’s beneficial to consider historical figures and data to identify patterns in customer behaviour and a sales representative's performance, revenue, and win-loss ratio.
Sales Pipeline Analysis
Sales pipeline analysis monitors the sales pipeline’s performance to understand the reasons why prospects end up becoming customers. It’s also possible to know the number of qualified leads and the probability of converting those leads into customers.
Sales Performance Analysis
This technique evaluates your current sales performance compared to industry standards and predetermined objectives to determine if the sales team is achieving their goals. This technique also includes monitoring customer service, finance, business operations, and accounting.
Sales Diagnostics Analysis
This technique helps you understand the reasons behind your sales trend patterns. For example, you noticed that the number of calls a sales representative made in October decreased in comparison to previous months. A sales diagnostic analysis will help you understand why the decrease occurred.
Product Sales Analysis
This technique helps you understand the sales performance of specific products or services. This is beneficial to companies that sell multiple products or variations of the same product or service. It helps you identify top-selling or least-selling products and compare product sales.
Sales Gap Analysis
Sales gap analysis is the process of comparing a company's current sales performance against its sales targets or potential. It helps identify areas where sales is falling short, providing insights into why these gaps exist and how to address them.
Sales Team Analysis
Sales team analysis is the process of evaluating the performance, effectiveness, and capabilities of a company's sales team. This helps identify strengths and weaknesses within the team and provides actionable insights for improving sales performance.
Customer Sales Analysis
Customer sales analysis is the process of examining sales data related to individual customers or customer segments to gain insights into buying behaviors, preferences, and trends. This analysis helps businesses better understand their customer base and make informed decisions.
Predictive Sales Analysis
This method uses historical sales data, statistical models, and machine learning techniques to forecast future sales outcomes. It helps businesses anticipate trends, customer behavior, and potential sales opportunities, allowing them to make proactive decisions and optimize sales strategies.


.svg)
.svg)
.svg)
.svg)