


CRM analytics and performance tracking help businesses measure sales results, understand customer behavior, and make better data-driven decisions.
This blog explains what CRM metrics are, how to track them, and how CRM dashboards simplify performance tracking for sales and marketing teams.
What is a CRM metric?
For instance, Superleap CRM tracks metrics like win rate, deal size, and pipeline coverage automatically, helping teams monitor results in real time.
Why CRM metrics matter (and a couple of numbers to prove it)
There are three broad advantages to tracking your CRM metrics: faster decisions, fewer dropped leads, and repeatable growth.
For context: Nucleus Research’s well-cited analysis found historically high ROI from CRM implementations (the famous “$8.71 returned per $1 spent” analysis), showing CRM can be a very high-leverage investment when implemented well.
Core CRM metrics: what to track, exactly (definitions + formulas)
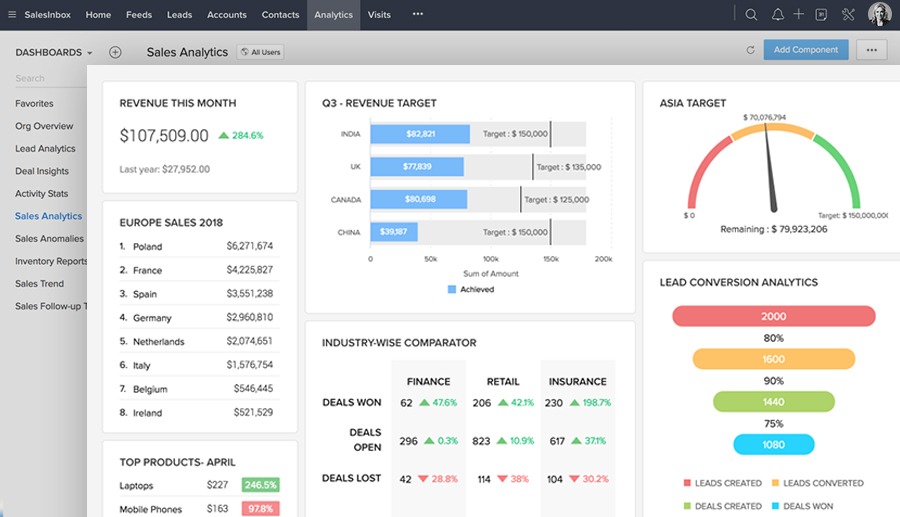
What is a CRM dashboard?
A CRM dashboard is a visual interface that brings all CRM metrics together, helping teams track performance across sales, marketing, and customer service. They make tracking performance easier by displaying live data on one screen.
These visuals look like charts, graphs, and key figures often arranged in 5-7 ‘widgets’ or cards representing trend lines, funnels, leaderboards, and alerts.
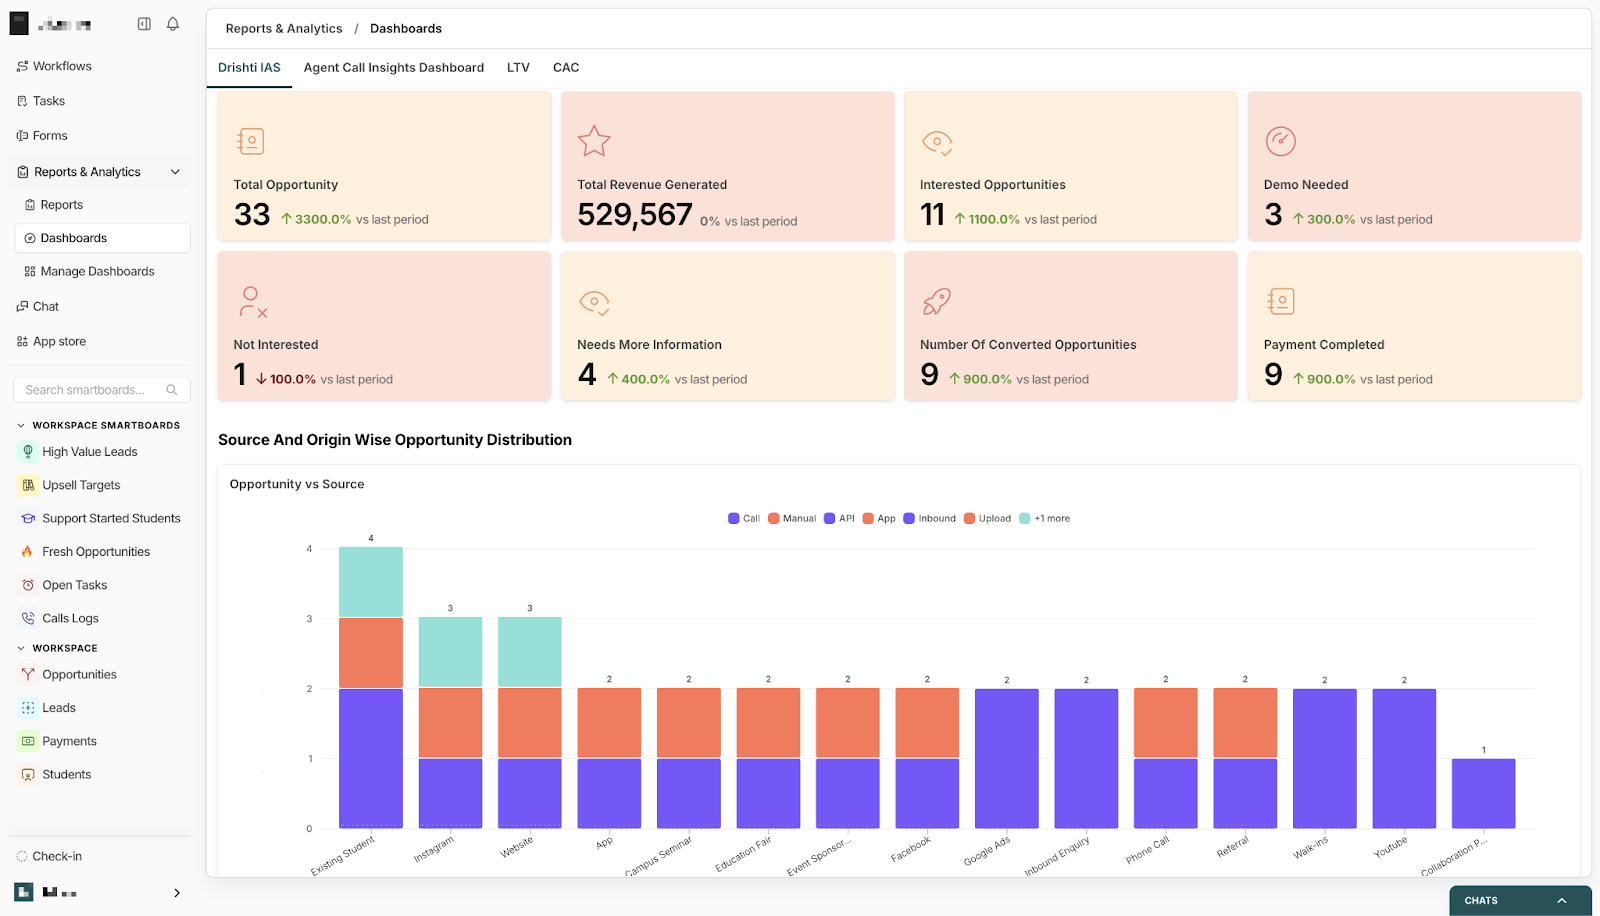
For example, Superleap’s CRM dashboard highlights pipeline movement, rep performance, and conversion trends instantly.
It is also worth noting that CRM dashboards are highly customizable. The metrics are designed for the person viewing it. A CEO dashboard can have revenue trends and growth rates while a sales manager’s can show individual rep performance & pipeline health.
What are the benefits of a CRM dashboard?
Centralized Data Access: All the data from multiple sources is aggregated and accessible in one single dashboard. This immediate visibility saves your time from juggling spreadsheets and reports.
Alignment & Accountability: When every team member views the same data, they stay aligned. Sales knows what leads marketing brings in, marketing sees if leads are converting, and the customer success teams monitor churn rates - all enforcing transparency. This shared view promotes accountability and collaboration.
Real-Time Monitoring: CRM dashboards update on a daily basis, so, if yesterday your sales were higher or lower than expected, you can see it immediately, and make quick decisions.
CRM dashboard examples
Superleap dashboard
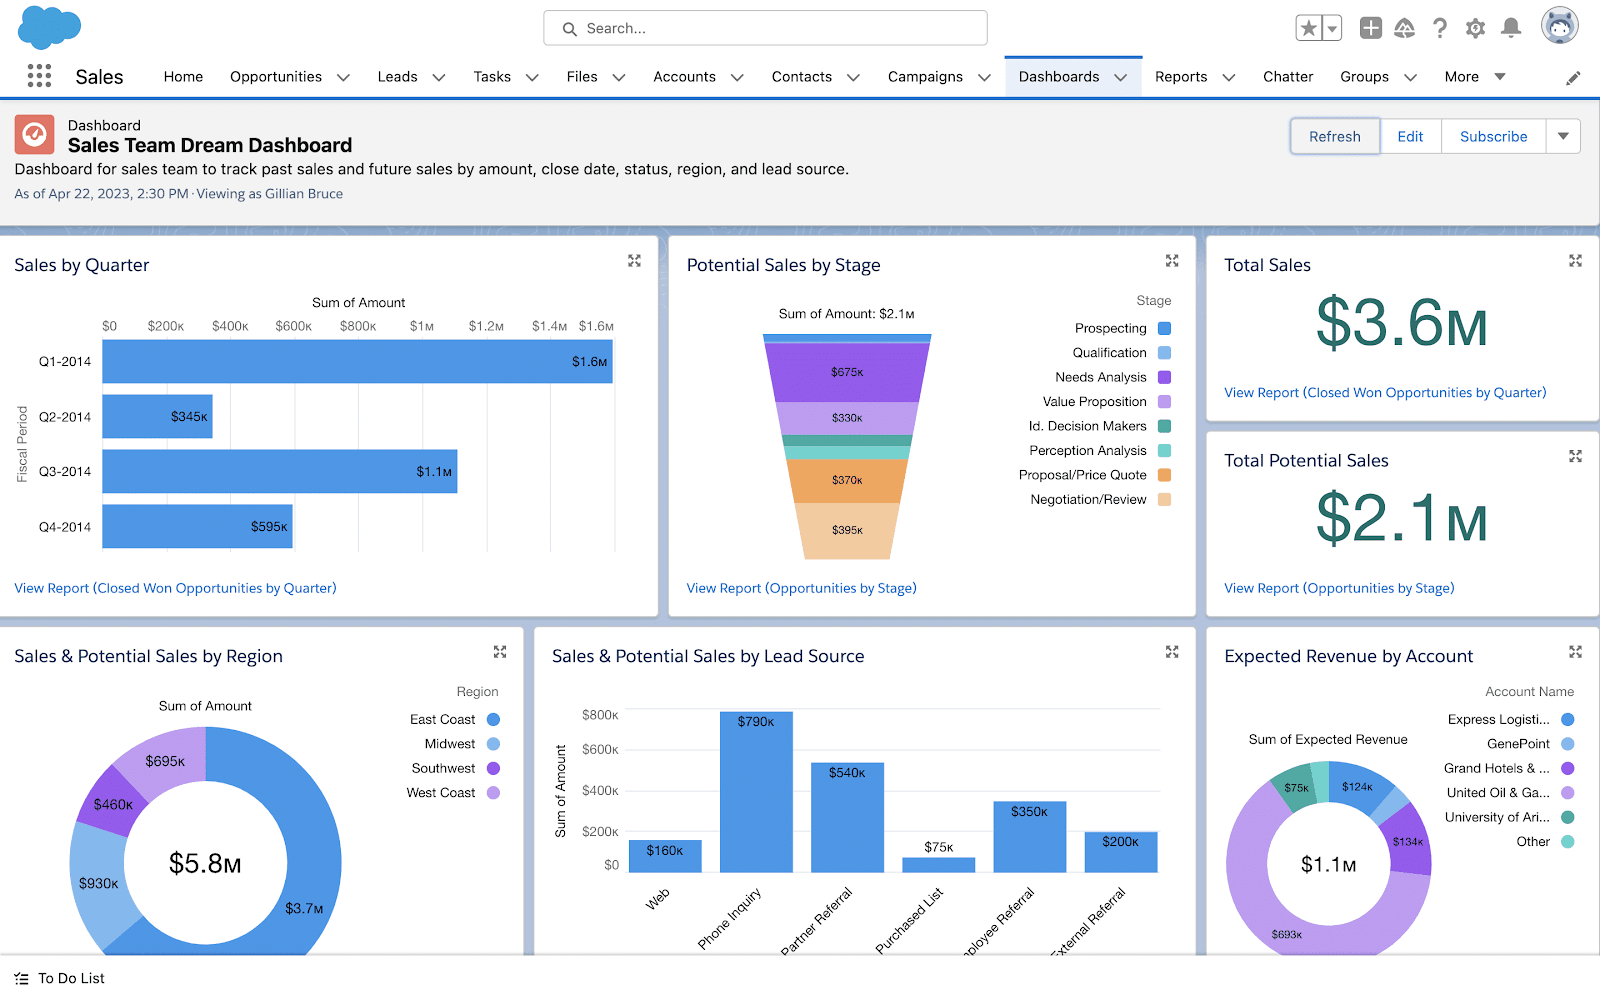
SalesForce dashboard
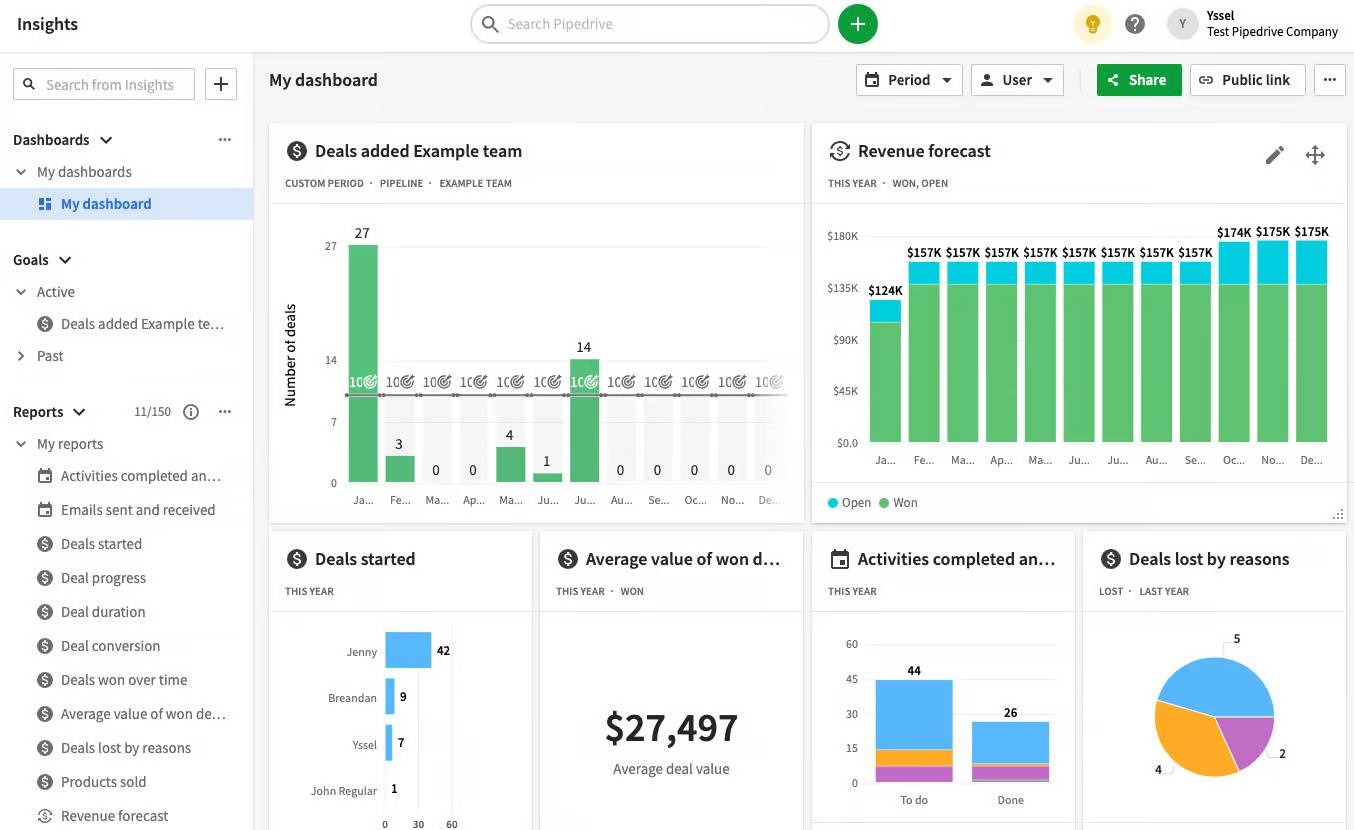
Pipedrive dashboard
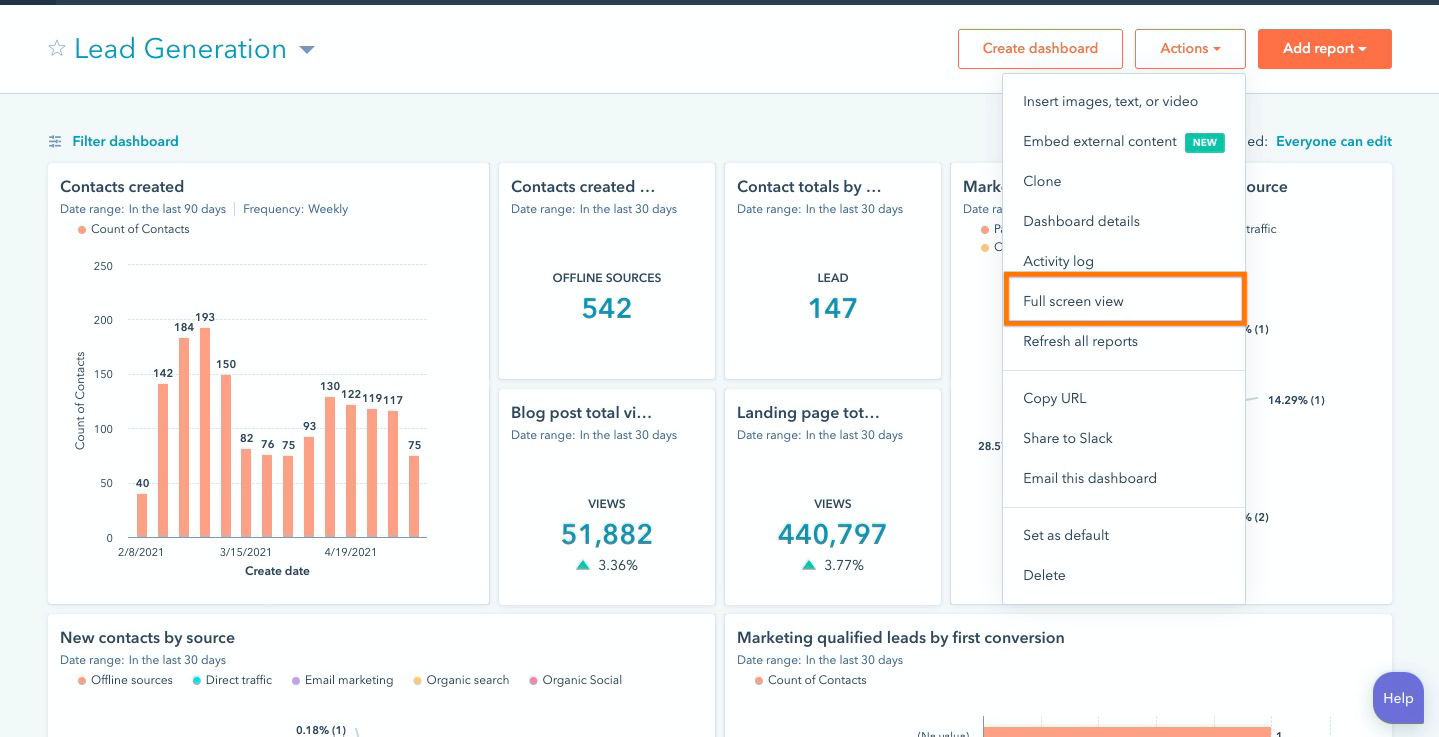
Hubspot dashboard
Zoho dashboard
Tools & tech stack
Use the CRM’s native dashboards for operational, real-time needs (activity, pipeline, rep leaderboards). Native dashboards are easiest to update and typically integrate with your workflows. Examples: Superleap, HubSpot, Zoho, Salesforce, Freshsales.
Use BI tools (Tableau, Power BI, Looker, Mode, Databox) for complex cross-system reports, advanced attribution, or finance-grade forecasting. BI tools are great when you need to blend CRM data with billing, product, and ad platforms.
Often the best approach is a hybrid: operational dashboards in the CRM for day-to-day work, and an executive BI dashboard for strategic, cross-functional metrics.
Conclusion
Picking the right CRM metrics to measure is crucial to the success of a business. When chosen correctly, a dashboard view facilitates quick and smart decision making.
Heading text
Nunc sed faucibus bibendum feugiat sed interdum. Ipsum egestas condimentum mi massa. In tincidunt pharetra consectetur sed duis facilisis metus. Etiam egestas in nec sed et. Quis lobortis at sit dictum eget nibh tortor commodo cursus.
Odio felis sagittis, morbi feugiat tortor vitae feugiat fusce aliquet. Nam elementum urna nisi aliquet erat dolor enim. Ornare id morbi eget ipsum. Aliquam senectus neque ut id eget consectetur dictum. Donec posuere pharetra odio consequat scelerisque et, nunc tortor.
Nulla adipiscing erat a erat. Condimentum lorem posuere gravida enim posuere cursus diam.

.png)